Welding Manager© offers a comprehensive dashboard that displays statistics and charts related to system entities such as Areas, Lines, Joints, and Welders, as well as the ability to act on displayed reminders. Upon logging in, the dashboard screen is the first page users see, with six main panels that can be clicked to reveal various views that present data in different formats.
- Joints Stats & Charts:
- Charts:
- Joints per Sheet,
- Joints per Joint Status,
- Joints per Joint Type,
- Total Joints Vs Welded Joints
- Activities over Time.
- Stats:
- number of Joints,
- Welded joints,
- VT Joints,
- RT Joints,
- Penalty Joints,
- Rejected Joints,
- Closed Joints.
- Charts:
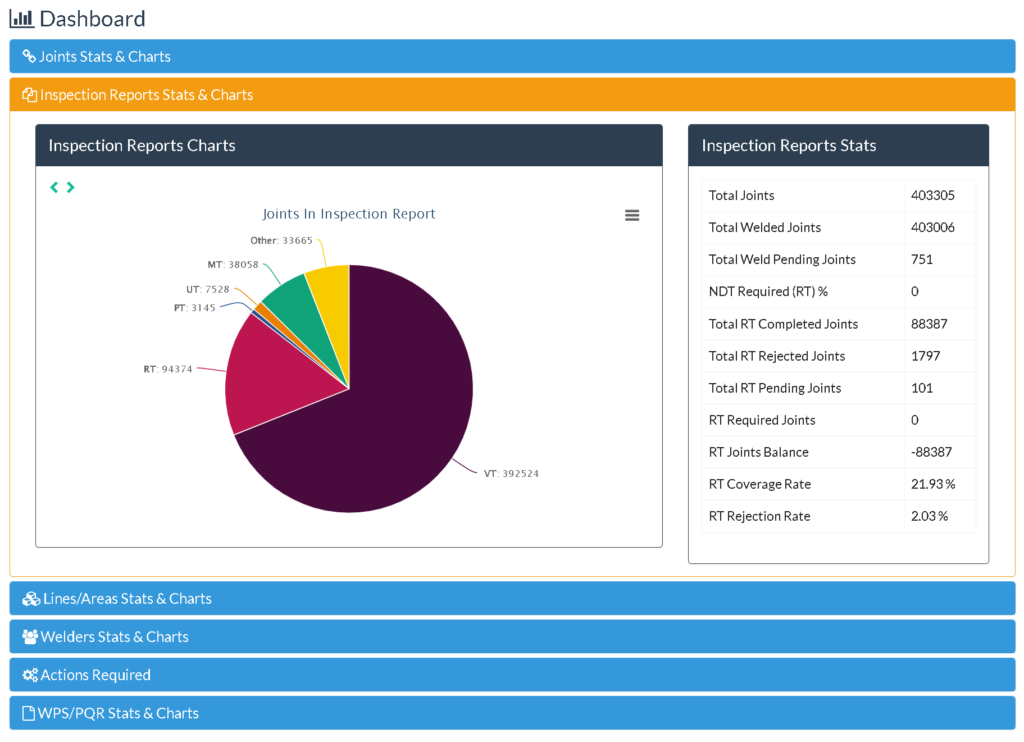
- Inspection Reports Stats & Charts:
- Charts:
- Joints in Inspection Reports
- Inspection Reports per Report Type
- Weekly Rejected Joints.
- Stats:
- Total number of Joints,
- Welded joints,
- Pending Welding Joints,
- VT Joints,
- RT Joints,
- Penalty Joints,
- NDT Required (RT) %,
- RT Coverage Rate,
- RT Rejection Rate.
- Charts:
- Lines/Area Stats & Charts:
- Charts:
- Lines Count per Areas
- Stats:
- Total number of Areas, Lines, Drawings, sheets, spools, and Joints.
- Total number of Areas, Lines, Drawings, sheets, spools, and Joints.
- Charts:
- Welders Stats & Charts:
- Charts:
- Welder per Contractor,
- WPS count per Welders,
- Welder Productivity over /time.
- Stats:
-
- Charts:
- WPS Stats & Charts:
- Charts:
- Welders per WPS
- Joints count per WPS.
- Stats:
- Charts:
- Actions Required:
- Tables:
- Recently added Inspection Reports,
- Inspection Reports Pending Actions
- All WPS welders with an expiry date of ±seven days.
- Tables:
Leave a Reply